
The crisis in supply chains we see presently is something I like to dub the “bat-terfly effect”: how one small bat (or one small lab, depending on your origin preference theory) led to a crisis in containerships, an increase in inflation, and a shock in supply chains. It’s important to note, however, that the pandemic wasn’t the cause but merely a trigger in a decade-long play that has led to the difficulties we see today. In this piece, we’ll try to explore some of the key factors that led to the current supply chain crisis, how long it could last for, and what the longer term implications will be.
What caused it?
The term “supply chain” is an interesting though misleading one. In the context of goods being made, this isn’t a single chain. It’s a complex web of interdependent relationships with many points of potential failure with shared infrastructure needs. The pandemic exposed just how interlinked all companies are, both at the very top of the manufacturing chain all the way down to the postman. The issues we see in goods manufacturing has been caused by three key factors: an unprecedented surge in demand; a contraction in supply; and the very nature of the manufacturing process.
The demand side of this equation is quite simple and well-known. As the pandemic hit, governments stepped in with significant fiscal measures aimed at cushioning the hit for households amid rising unemployment. As work-from-home was adjusted to, as savings built from insurance packages, and most importantly, as the vaccine was approved and rolled out, consumer confidence rose and spending alongside this! The US consumer is still spending at a rate higher than pre-pandemic levels with Citi reporting that credit card purchases are at 160% the 2019 average.
The surge in demand would have perhaps been straightforward to deal with were it not for a crisis on the supply side. This has continued to be exasperated by China’s ongoing “zero-covid” policies, notably seen in Beijing during the past month. Yet if we dig deeper into the underlying longer-term trends, we’ll see a consistent theme of complacency at important nodes within the supply network.
Decarbonisation a driver
At the very start of the supply chain are your access to raw materials. In the decade leading up to the pandemic, we’ve seen a chronic underinvestment in mining infrastructure and exploration, with miners favouring returning cash to shareholders over future growth. The average capex-to-operating cash flow ratio across the leading miners fell to 43% in 2017-21 from 78% in 2012-16, and analysts polled expected it to decline further in 2022-24 to 34%. Ratios calculated by Dow Jones Newswires based on absolute reported and estimated figures provided by FactSet.
Supply physically cannot keep up with the demand for transition metals, and the new regulations imposed means it is often takes 3-4x longer to open a new mine than it otherwise would have pre-GFC. This underinvestment was seen in a variety of industries (shipping, most notoriously) and laid the foundation for supply chains to be stretched given a surge in demand.
The final category of causes is around the manufacturing process and the rise in optimisation. This trend that we’ve seen over the past 40 years was focused around a move to just-in-time inventory management, outsourcing, and streamlining. Pre-pandemic, risk management was considered and in place with companies thinking about how to mitigate the risk of flood, fires, political instability etc. Yet the pandemic was a disruption at the same time, in a correlated way, at all nodes, and with surging demand. Supply chains just aren’t designed to deal with this, particularly with a supremely unlikely tail event. Fundamentally, the cause of the supply chain crisis is in the very design of the manufacturing process – they aren’t designed to operate well under systemic duress.
How long will it last for?
It’s important to note that this crisis isn’t caused by just a single bottleneck: there are bottlenecks existing at various points in the supply chain. And an increase in capacity at one node will shift the bottleneck further up or down the chain. Upon identifying and fixing the bottleneck, it then exposes another bottleneck which needs to be fixed, and so forth. The lack of containerships to meet consumer demand was one such bottleneck, and freight rates appear to be a leading indicator showing how the unclogging of supply chains is proceeding.
Containerships and Supply Chain Pressure
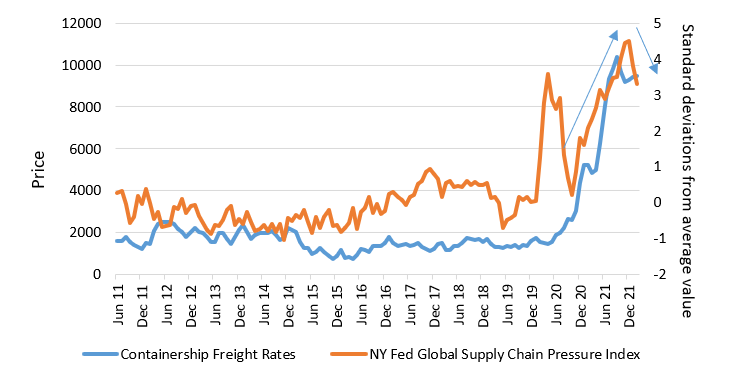
Source: Bloomberg 30.06.2011 – 28.02.2022
In my conversations with liners, their predictions of a return to normality has been inconsistent and frequently pushed back: what was previously guided as Q1 2022 is now Q3 2022, and I wouldn’t be surprised if this continues. Having said that, freight rates could fall given the amount of new containerships that have been ordered by liners to meet elevated demand.
Order book for containerships
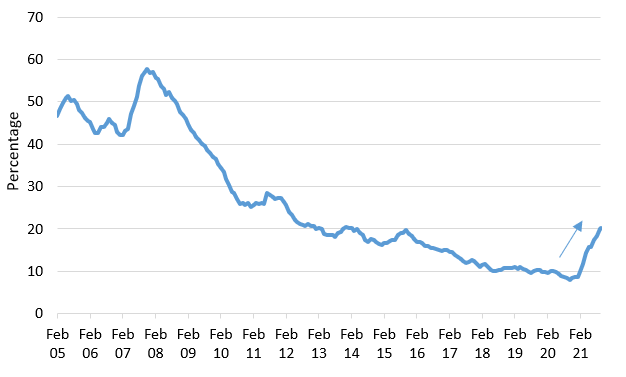
Source: Bloomberg 28.02.2005 – 15.10.2021
With new ships likely to hit the water at the start of 2024, I believe that this will prove to be a turning point for the freight market’s logistics issues.
Future trends
The first trend that we’re likely to see is “the great onboarding”. The pandemic and Ukraine War have exposed flaws in the interdependent, globalised model of trade we’ve become so used to. We’re likely to see governments and companies try to onboard supply chains where possible, and diversify them where not. We’ll see an increase in stockpiling of essential products which will further give impetus to higher freight rates. This could be intensified by a transition from a “just-in-time” to a “just-in-case” manufacturing process causing heightened levels of stockpiling. And we’re likely to continue seeing a rise in the desire for self-sufficiency, particularly within energy. Lastly, the consequences are likely to breed a further investment in technological efficiencies. What better way to overcome the shortage of workers than to no longer need workers? Drone deliveries testing has largely been a success, farmers are investing in AI to further increase crop yields, and autonomous vehicles ensure that the talent bottleneck is one that firms are seeking to put to bed.
Global Trade as % of GDP
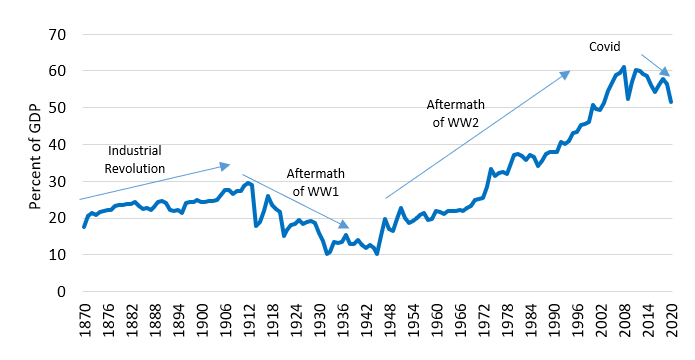
Source: World Bank 1870 – 2020
Yet the irony is that the trend towards de-globalisation relies completely on cooperative trade between countries. The investment in renewable technology is utterly dependent on the access to the raw materials that create the technology, and these resources are mined and sourced in a handful of mineral-rich localities. That said, as seen in the chart above, this narrative is often cyclical: protectionism is often the consequence of war and, after a period of peace, countries once again seek interdependence as a means to avoid conflict.
How we played it
One of the sectors to benefit most from the pandemic was, of course, the shipping and freight industry. Revenues doubled, EBITDA tripled, and leverage zeroed. This was a space we played in through CMA CGM SA, the number 2 in global freight.
CMA CGM spread versus Index
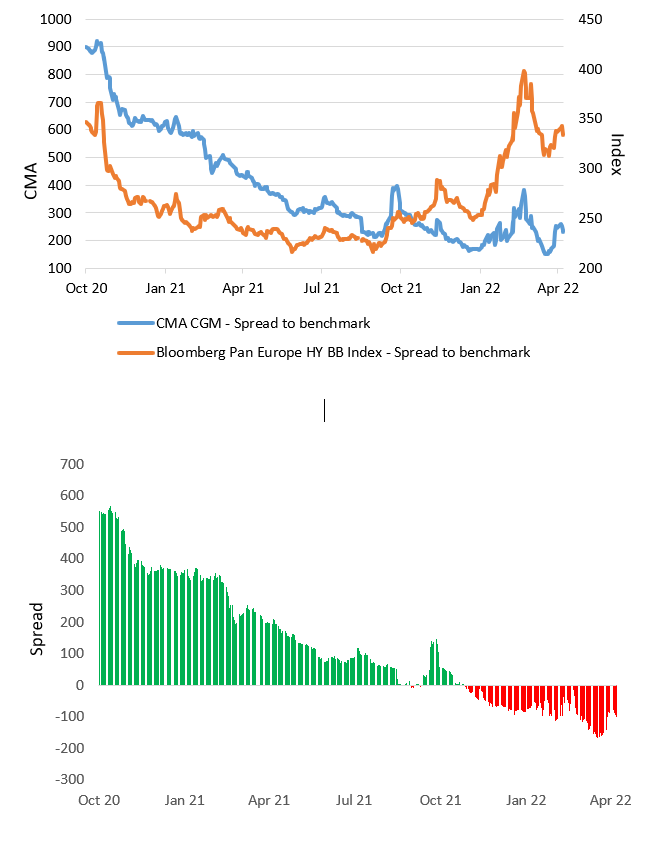
Source for both charts: Bloomberg 16.10.2020 – 22.04.2022
Having gotten involved in the name at the start of 2021, we saw freight rates remaining elevated, cash flow generation reaching record levels, and diversification through M&A meaning that containership names would be more defensively positioned in the future. This led to the massive compression in spreads we see above. The spread of CMA (rated B+) relative to the higher-rated BB Euro Benchmark is at its historic tights and 1.2 standard deviations below its mean. Today, although we like this space from a fundamental perspective, it’s difficult to continue being involved from a valuations perspective. As such, we recently took profits on an outperforming investment.
